10 Best Data Visualization WordPress Plugins
Get ready to experience something amazing today. We are presenting some best WordPress visualization plugins, database plugins and chart plugins that help you to create beautiful diagrams, charts and graphs. You can easily use these graphs on your website and blogs. All these graphs and Tables Builders WordPress Plugins are responsive which means that you can easily view them on all kinds of electronic devices like mobile phones, tablets, desktops, iPads etc. We have some data conversion plugins also that help to convert the documents into beautiful graphs, tables, charts and diagrams automatically. These visualization plugins are suitable for journalists, bloggers, students, agencies, organizations and many other people and kinds of firms.
Yes, we have amazing bunch of libraries with us today. If you are looking for such attractive and helpful data visualization plugins then take a look at our recommendations today. We are sure that you will actually admire them for your business.
Visualizer: Tables and Charts Manager for WordPress
Visualizer is the best WordPress chart plugin as it quite simple to use, easy to manage and helpful toward the embedment of tables and wonderful charts into your pages and WordPress posts. This plugin basically uses DataTables.net, Visualization API and ChartJS to simply add interactive diagrams and charts. It supports cross browser compatibility. Different charts like column chart, area chart, line chart, table chart, bar chart, scatter chart and geo chart are based on HTML5/SVG technology.
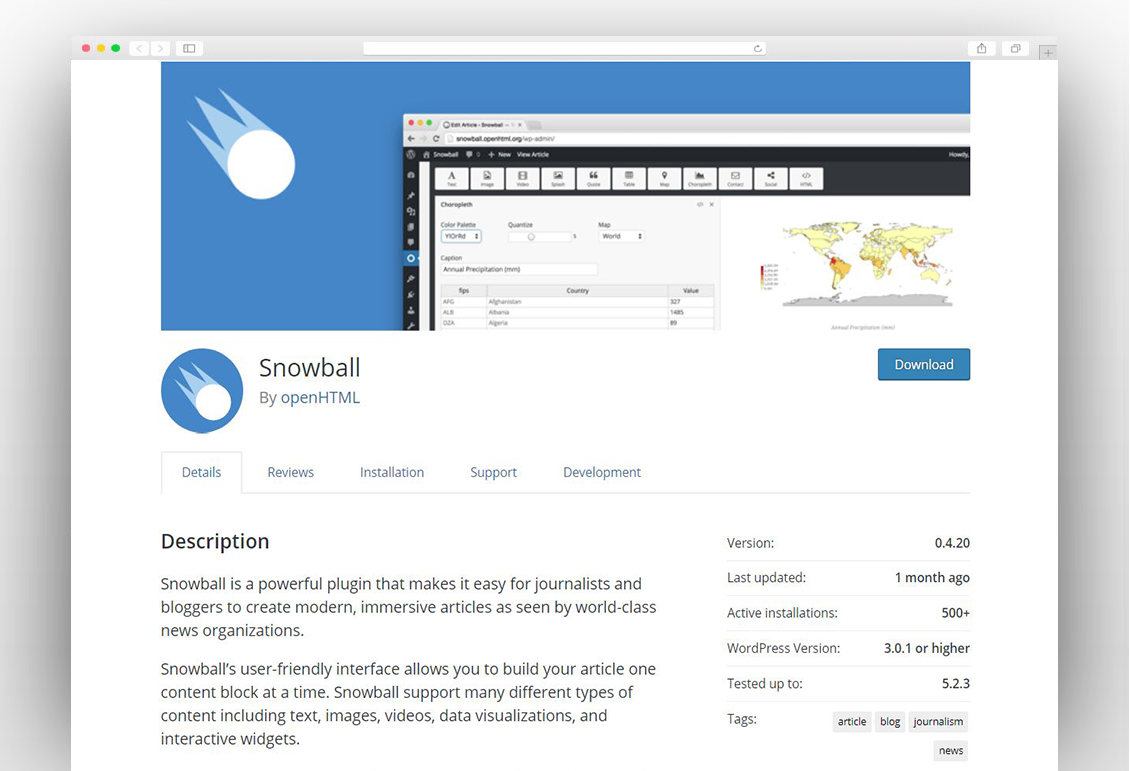
Snowball
Snowball is a visualization WordPress plugin that is suitable for the bloggers, world class news agencies and journalists. It allows you to simply build an article with the support of different types of content like videos, text, data visualizations, images and beautiful widgets. This visualization WordPress plugin was developed by openHTML research team at Drexel University. It supports many modules like Media, Basic, Social, Data and Meta.
M Chart
M Chart is another visualization WordPress plugin that deals with the carts and diagrams. It allows you to manage the sets with the help of spreadsheet interface. It presents the data in the form via Hightcharts or Chart.js libraries. Charts can easily be embedded with the help of handy shortcode.
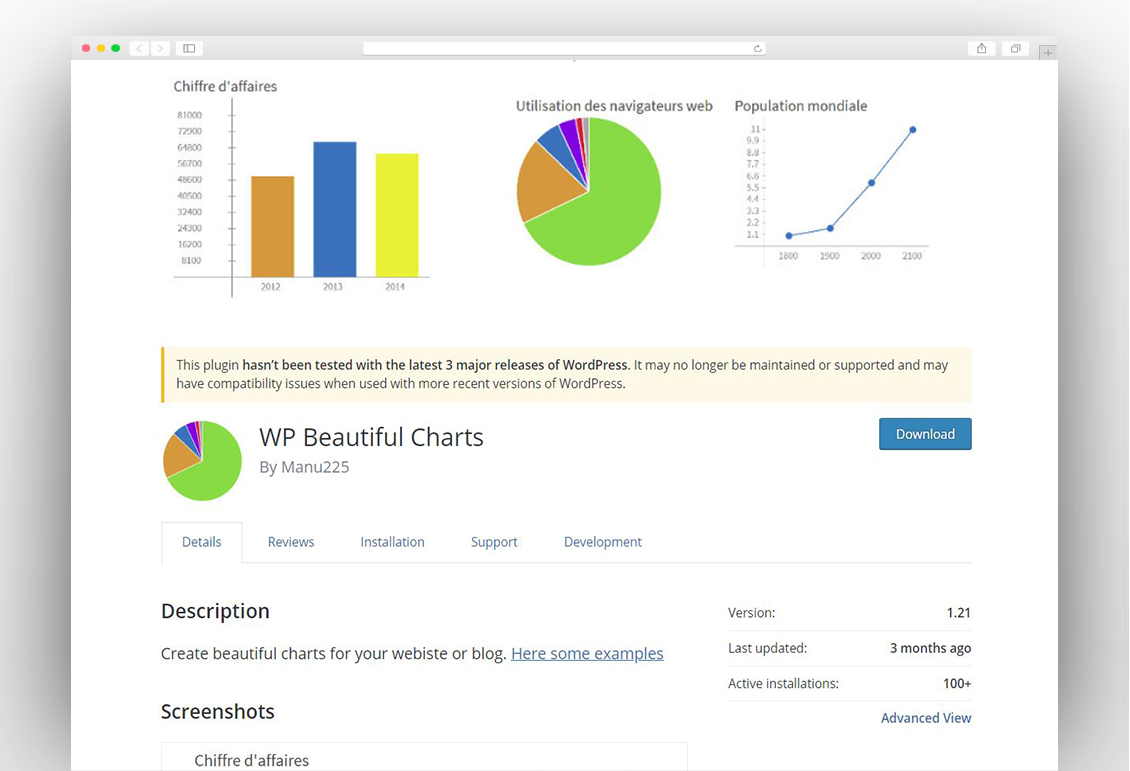
WP Beautiful Charts
WP beautiful charts allow you to simply create the beautiful charts and diagrams on your website or blogs.
TablePress
TablePress is a visualization WordPress plugin that allows you to create and manage beautiful diagrams and tables. It is easy to embed the tables into pages, posts and text widgets with the help of simple shortcodes. The data of the table can easily be edited as well in a spreadsheet like interface. Any type of data and formulas can be included in a table. An extra JavaScript library adds several features like filtering, sorting, pagination etc. It is easy to import and export the tables to/from CSV, Excel, JSON and HTML files.
Blazing Charts
Blazing Charts is the free visualization plugin that contains those libraries that are available for free and actually present in the market. These libraries can be used for commercial purposes like branding, personal and non-profit projects. You will find a proper list of libraries available in the plugin.
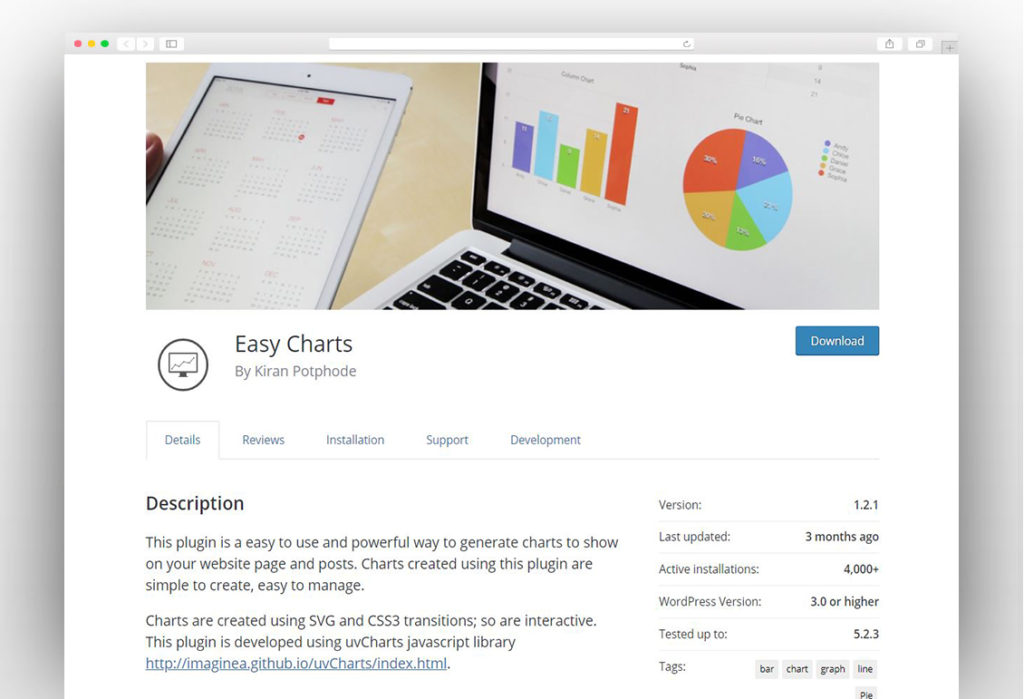
Easy Charts
Easy Chart is a helpful plugin that helps to add beautiful charts and diagrams to your website and blog posts. Charts are created with CSS3 transitions and SVG technologies. There are 12 kinds of supported charts like step up bar chart, percent bar chart, bar chart, stacked bar chart, line chart, stacked area chart, area chart, percent area chart, waterfall chart, pie chart, donut chart and polar area chart. It has various important features like uniform data representation, downloadable as image, elegant designs and free embedment. These charts come with proper colors and designs. All of these charts are responsive too.
Infogram – Add charts, maps and infographics
Infogram is a WordPress visualization plugin that is helpful for adding the maps, charts and infographics. To create animated and beautiful reports, charts and graphics, you do not need to have enough coding knowledge. This plugin is generally used by newsrooms, marketing teams, students and bloggers in the entire world. These charts and diagrams are responsive and can be easily seen in all kinds of screen sizes.
Inline Google Spreadsheet Viewer
Inline Google Spreadsheet Viewer is a database WordPress plugin that has the capacity to change the CSV files, Google Spreadsheet and MySQL database into beautiful and wonderful graphs, tables, charts and other diagrams. Live previews of DOC, PDF and XLS are supported by Google Docs Viewer. You can easily update, create, customize, use and embed beautiful graphs and charts from different kinds of documents.
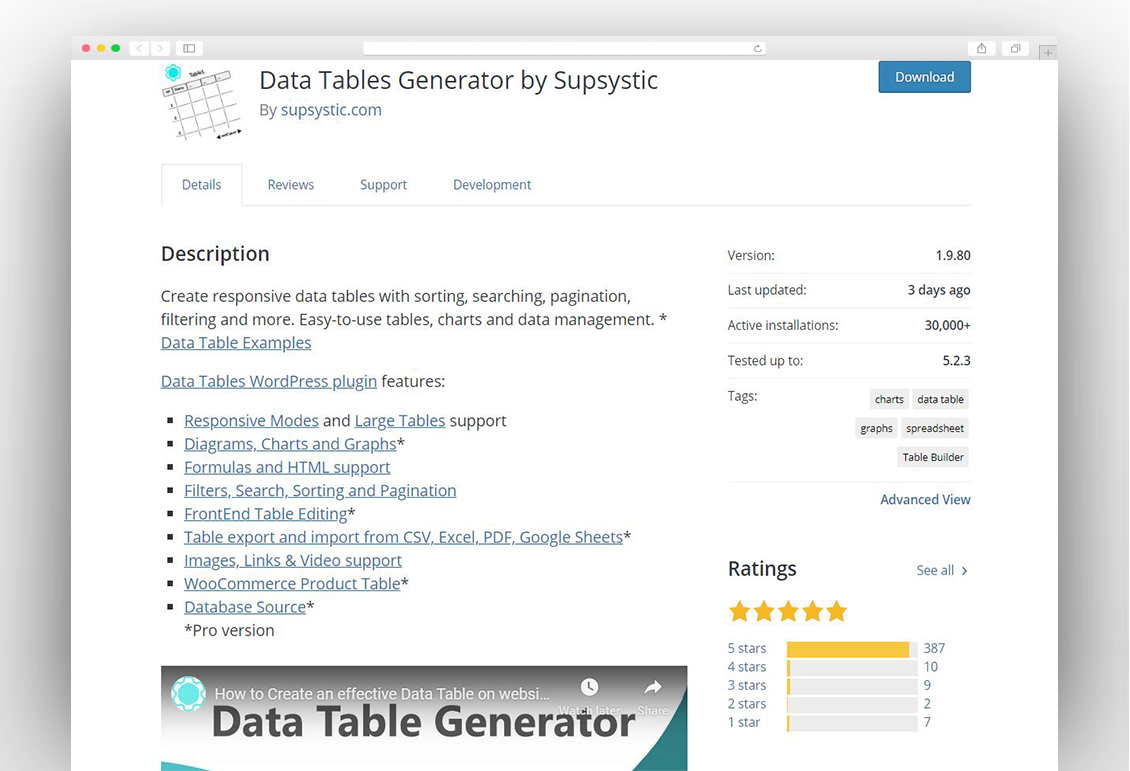
Data Tables Generator by Supsystic
It is now easy to easily create data tables with the help of searching, sorting, pagination, filtering and much more. It has various features like large tables support, responsive modes, diagrams, graphs and charts creation, HTML and formulas support, Woocommerce product table feature, Database Source, FrontEnd table editing and other important features. It helps to manage and process SEO friendly data tables. Its responsive editor and intuitive settings option save a lot of time. Plus, all tables are responsive and can be easily seen on all kinds of electronic devices like mobile phones, tablets, desktops etc.

